
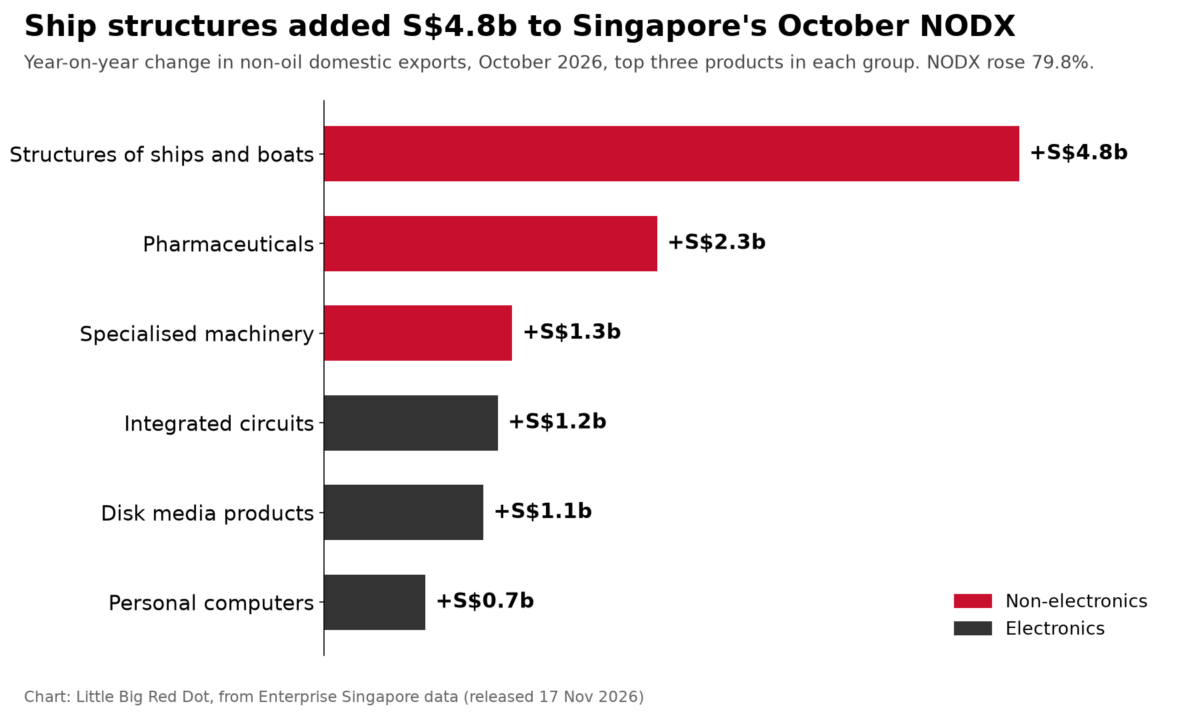
Singapore’s non-oil domestic exports grew 79.8 per cent in October from a year earlier, up from 68.3 per cent in September, and S$4.8 billion of the increase came from a single line: structures of ships and boats.
That one line matters for how you read the headline. Enterprise Singapore’s 17 November release gives no growth rate for ship and boat structures, saying the exceptionally high percentage reflects a low base in October 2025. It calls them “lumpy exports”. Big vessels and structures leave in a few large, irregular deliveries, so they can lift one month and drop out of the next.
What drove the 79.8 per cent
Non-electronic exports, which include ships, drugs and machinery, rose 81.9 per cent, up from 54.1 per cent in September. Three products did most of the work:
- Structures of ships and boats, up S$4.8 billion
- Pharmaceuticals, up 253.1 per cent, or S$2.3 billion
- Specialised machinery, up 57.3 per cent, or S$1.3 billion
Electronics grew 73.9 per cent. That is still strong, but it is slower than September’s 107.6 per cent. Integrated circuits rose 53.1 per cent (S$1.2 billion), disk media products 189.6 per cent (S$1.1 billion) and personal computers 81.0 per cent (S$0.7 billion). Enterprise Singapore puts the electronics growth down to “sustained AI-related demand”.
Over the first ten months of 2026, NODX is up 33.6 per cent. At the end of September, the nine-month figure stood at 27.6 per cent.
Where the goods went
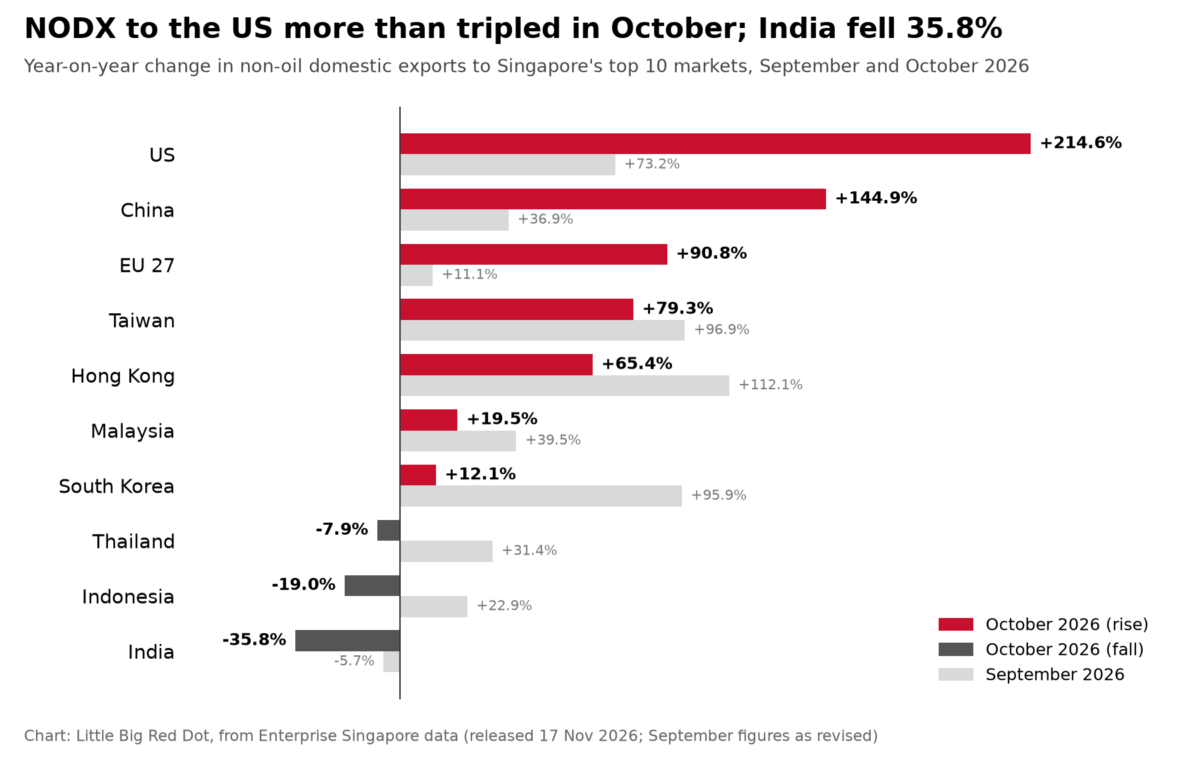
Seven of the top ten markets bought more. Exports to the US rose 214.6 per cent, driven by pharmaceuticals, disk media and PCs. China rose 144.9 per cent on non-monetary gold, specialised machinery and chips. Taiwan rose 79.3 per cent.
Three markets went the other way: India fell 35.8 per cent, Indonesia 19.0 per cent and Thailand 7.9 per cent. India was already down 5.7 per cent in September.
The revisions, and the next print
September’s NODX growth now reads 68.3 per cent. The first estimate, published on 16 October, was 68.4 per cent. August has also moved, from 46.1 to 46.0 per cent. Small changes, but they are a reminder that each month’s figure is a first reading.
Non-oil re-exports, goods that come into Singapore and leave again, rose 48.1 per cent, almost unchanged from 47.8 per cent in September. Total merchandise trade grew 50.7 per cent.
NODX is a trade measure. It tracks what Singapore-based firms ship, not what households earn or spend, and on its own it does not set a CPF rate, an HDB price or a tax bill. Enterprise Singapore releases trade data on the 17th of each month, so November’s figures are due on Thursday, 17 December. NODX by market is on SingStat Table Builder, and the October release is on Enterprise Singapore’s site.