
Wall Street closed out a dramatic week on Friday, 18 April 2026 with a thunderous rally as Iran’s Foreign Minister announced that the Strait of Hormuz is completely open to commercial shipping. The news triggered an extraordinary surge across all three major US indices — sending the S&P 500 to a new all-time high of 7,126 — and caused crude oil prices to plunge more than 10% in a single session. For Singapore investors, this seismic shift in the global geopolitical landscape carries significant implications for portfolios, REITs, and the broader economy.
Market Summary: Friday, 18 April 2026
The numbers tell the story of one of Wall Street’s most remarkable trading days in years:
- S&P 500: 7,126.06 (+84.78 points, +1.20%) — new all-time high
- Dow Jones Industrial Average: 49,447.43 (+868.71 points, +1.79%)
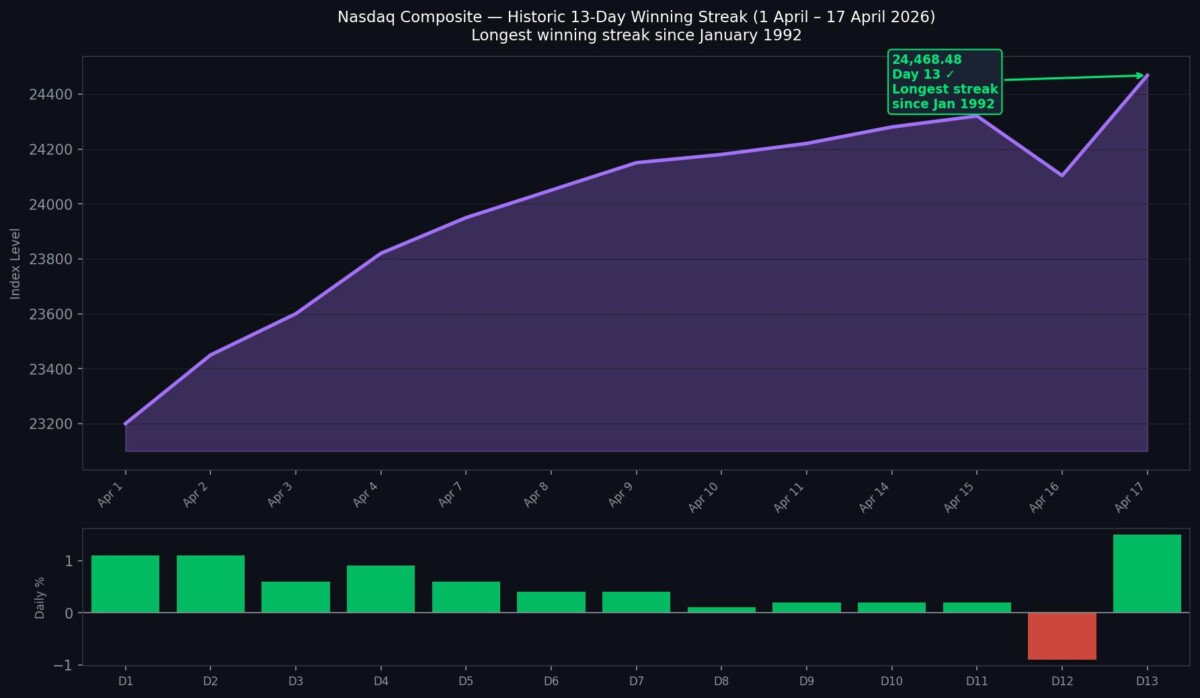
- Nasdaq Composite: 24,468.48 (+365.78 points, +1.52%) — 13th consecutive gain, longest winning streak since January 1992
- Brent Crude Oil: ~$88–90 per barrel (down ~10–11%)
- WTI Crude Oil: ~$83–84 per barrel (down ~11–12%)
- Gold: ~US$4,800 per ounce
The catalyst was straightforward but momentous. Iran’s Foreign Minister Seyed Abbas Araghchi posted on social media that passage for all commercial vessels through the Strait of Hormuz was “completely open” for the duration of the ceasefire. The Strait carries approximately one-fifth of the world’s daily oil supply — its blockade since late February 2026 had been the single biggest driver of energy price inflation and stagflation fears that had weighed on global markets for weeks.
Oil’s Historic Single-Day Collapse
The oil market’s reaction was nothing short of stunning. Brent crude futures fell approximately 10–11% — one of the largest single-day declines in recent memory — after Iran’s announcement removed the immediate supply-disruption premium that had kept prices elevated well above US$100 per barrel for much of the preceding six weeks.
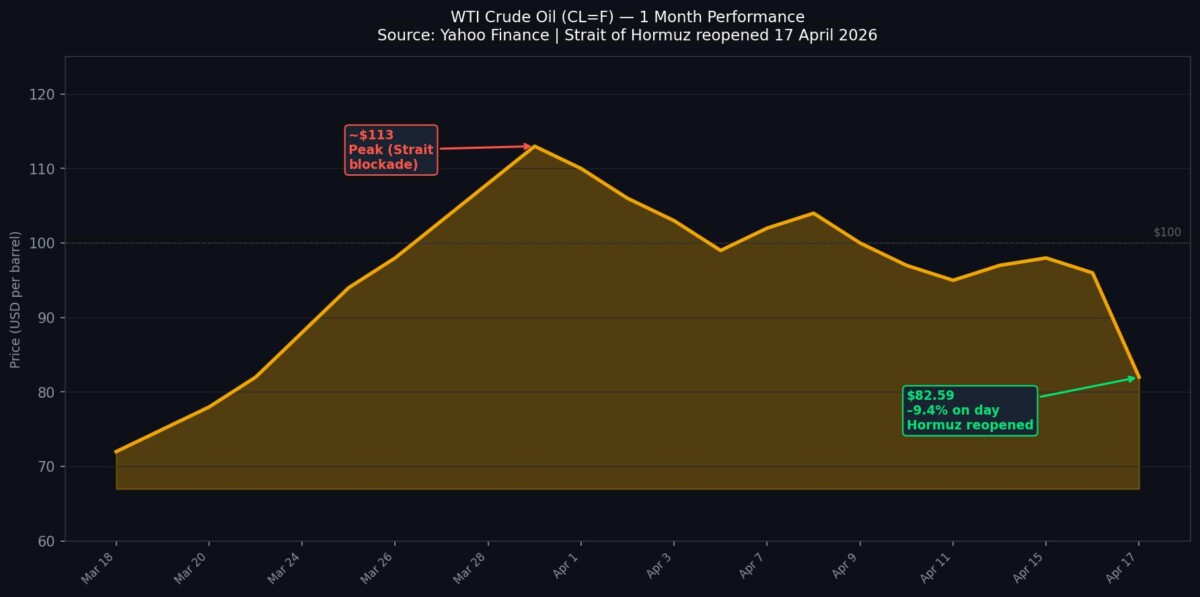
US West Texas Intermediate (WTI) crude dropped to approximately US$83–84 per barrel, while Brent settled near US$88–90. Petrol prices at the pump in Singapore, which had crept up following the Strait of Hormuz closure, are likely to ease in the coming weeks as lower crude costs filter through the supply chain.
Gold — which had surged to approximately US$4,800 per ounce as a safe-haven asset during the geopolitical uncertainty — held relatively firm, suggesting that while immediate war risk has subsided, investors retain some caution about the durability of the ceasefire.
The Nasdaq’s Historic 13-Day Win Streak
Perhaps the most remarkable technical achievement of Friday’s session was the Nasdaq Composite notching its 13th consecutive day of gains — its longest winning streak since 9 January 1992. This extraordinary run, which began on 1 April 2026, was fuelled by a combination of easing geopolitical tensions, cooler-than-expected inflation prints, and a powerful resurgence in technology stocks.
The technology sector led the charge throughout this period:
- Nvidia (NVDA) recorded its 11th consecutive winning session — the longest daily gain streak on record for the chipmaker
- AMD touched an all-time high, capping a 12-day winning streak during which the stock climbed more than 40%
- Microsoft (MSFT) gained more than 14% for the week — its best weekly performance since April 2015
Investors poured approximately US$3 billion into the Invesco QQQ Trust (QQQ) — the ETF tracking the Nasdaq-100 — on Thursday alone, underscoring the FOMO (fear of missing out) dynamic driving late-stage buyers into the market.
Key Movers on Friday
The rally was broad-based, but several stocks stood out as leaders:
- Sherwin-Williams (SHW): +4.3% — benefiting from lower oil prices (paints and coatings are energy-intensive to produce) and optimism over a recovering housing market
- Home Depot (HD): +3.66% — lower oil prices translate to cheaper logistics and building materials, boosting home improvement sentiment
- 3M (MMM): +3.23% — industrial conglomerate rallying on easing cost pressures
- Merck (MRK): +3.13% — healthcare defensives also participated in the broad rally
Technical Analysis: S&P 500 Breaks Through Key Resistance
From a technical standpoint, Friday’s close at 7,126 is highly significant. Earlier in April, the S&P 500 had been trading below both its 50-day and 200-day moving averages following the Iran conflict shock in late February — a “Death Cross” formation that historically signals caution. The past two weeks of relentless buying have seen the index power back through both moving average levels, and the new all-time high close suggests the Death Cross has been thoroughly invalidated. Key technical levels to watch:
- Support: 7,000 (psychological level) and 6,900 (prior resistance turned support)
- Resistance: 7,200–7,300 (uncharted territory — next target for bulls)
- RSI: Now approaching overbought territory (~70) after the 13-day run; a brief consolidation would be technically healthy
- Volume: The rally has been accompanied by above-average volume, adding credibility to the move
Singapore Market (STI): Riding the Global Wave
Singapore’s Straits Times Index (STI) closed at approximately 5,036 on Friday — up 0.6% and reaching its highest level since 23 February 2026. The gains were broad-based, with the finance sector (DBS, OCBC, UOB), services, and retail trade all contributing positively.
For Singapore investors, key implications include:
- Singapore banks (DBS, OCBC, UOB): Likely to benefit from a stabilising interest rate environment and improved regional economic outlook
- Singapore REITs (S-REITs): Lower oil prices reduce operational costs for logistics and industrial REITs; a more stable rates outlook supports REIT valuations generally
- Singtel: A recovery in regional sentiment should support the telco giant’s regional operations
- CPF Investment Scheme (CPFIS): Members with broad equity exposure through unit trusts or ETFs have seen meaningful paper gains — this may be a good time to review portfolio allocations and rebalancing targets
What to Watch This Week
- Ceasefire durability: Markets will be watching carefully whether the Iran ceasefire and Strait of Hormuz reopening holds. Any reversal would immediately spike oil prices again
- US earnings season: Major US companies reporting Q1 results — guidance will be key given the volatile energy cost environment
- Fed commentary: With inflation pressures easing on the energy front, Federal Reserve commentary on rate cuts will be closely scrutinised
- MAS policy: The Monetary Authority of Singapore tightened its policy settings at its April meeting — watch for follow-through commentary
- China and Hong Kong: Regional Asian markets have also rallied; further stimulus signals from Beijing could extend gains
Singapore Investor Perspective
For Singaporeans investing through local brokers such as DBS Vickers, POEMS (Phillip Securities), or Tiger Brokers, the past two weeks have provided a powerful reminder of the importance of staying invested during periods of geopolitical uncertainty. Those who held their nerve — or added to positions during the Iran-driven dip in late February and early March — will have been richly rewarded.
At current S&P 500 valuations (forward P/E approximately 22–23x), the index is not cheap by historical standards, but neither is it in bubble territory given the interest rate trajectory. For Singapore investors with US equity exposure via ETFs such as the iShares Core S&P 500 ETF (IVV) or SPDR S&P 500 ETF (SPY), the new all-time high is a natural point to consider whether rebalancing or profit-taking makes sense within your overall asset allocation.
Also read: Singapore Condo Supply Crunch 2026: Just 17 New Launches as Prices Plateau
This article is for informational purposes only and does not constitute financial advice. Please consult a licensed financial adviser before making investment decisions.